Once you purchase this product, you will be provided with a link, login credentials and license key(s) within one business day of your purchase to download.
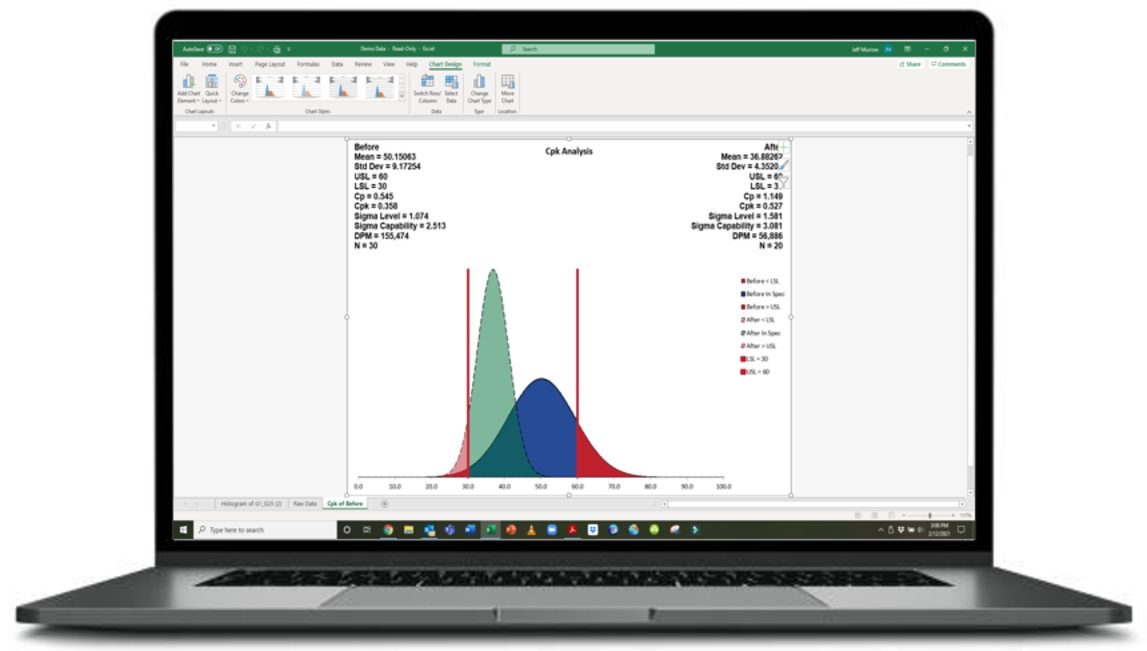
Creates control charts, diagrams (histograms, Pareto, box plots, etc.), MSA, t-Test, F-Test, etc., from within Excel. Upon installation, SPC XL 20 integrates into Excel and appears as a menu item on the Excel toolbar. The charts and statistics produced in the standard Excel workbooks can be shared with anyone who has Excel (even if they don’t own SPC XL). Control charts may be updated without recreating the chart.
Transform Your Data into Insights with SPC XL Software for Windows Microsoft Excel
The SPC XL software is a powerful tool among leading statistical software applications that can assist you in turning data into insights. It can assist you in identifying trends and patterns in your data values and making informed decisions based on that information. It is designed explicitly for quality control and Six Sigma practitioners and provides various statistical tools to assist them in analyzing data, review, and improving their quality control processes.
Importance of Statistical Process Control (SPC Software)
Companies must deal with escalating operational costs, such as the price of raw materials and fiercer competition. Consequently, having operational control is advantageous for organizations.
Organizations must continuously work to increase quality and efficiency and cut costs. Many companies are still performing quality control checks after production.
Businesses can transition from detection-based to prevention-based quality control with the aid of SPC. By looking at SPC graphs and analyzing continuous data, organizations can reasonably predict how processes will behave.
This can help businesses detect errors early, saving time and money. SPC also allows businesses to monitor the entire process, not just the final product. It can be beneficial as it can identify issues that cannot be seen in the final product. SPC is a robust quality control method that can help organizations improve their bottom line.
SPCXL Features
Some of the key features of SPC XL include:
Statistical Analysis Tools
The statistical analysis tools and diagrams used in Six Sigma are designed to help identify and understand the sources of the process variation. These tools can be used as a platform to determine whether a process is stable and capable of meeting specifications and identify opportunities for improvement. These can improve data points comparison and allow a user to predict the probability by analyzing the dataset using the tool.
Histograms, Process Capability Analysis (Cpk), Pareto Diagrams, Scatter Plot (with regression fitting), Pareto, Dot Plot, Box Plots, Multiple Regression, Hypothesis Testing, Confidence Intervals, and Sample Size Calculations are some of the analysis tools and diagrams available.
Control Chart Visuals
Control charts help monitor and control a process or function by allowing users to track process performance over time. SPC XL is the easiest statistical software that provides several types of control chart visuals and properties with a clear overview of the results, including:
– X-bar & R Chart
– X-bar & S Chart
– Individuals & Moving Range Chart
– Cumulative Sum Chart
– Exponentially Weighted Moving Average Chart
– Time Series Plot
FAQS
Related Topics:
data point instructed statistics, control charting, spcxl, spc xl add-in, spc for excel free download, spc lean, six sigma spc, spc six sigma, download six sigma software, spc add-in for excel, spc excel free download, spc latest edition, spc xl add in, histogram, observations,


