Measurement Variation
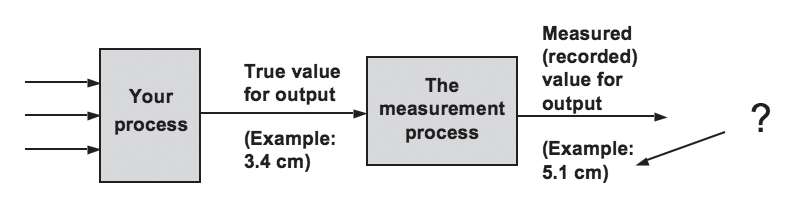
In any process performance, there is variability in the products or items being measured, but there may also be process variability in the way we measure those products or items. Variation in the measurement system is known as measurement error. Ideally, this measurement error should be small. And in order to draw good conclusions, we must have accurate and trustworthy data. When working with data, an important first step is always to understand and quantify the measurement error so we can determine if the data we’re using to guide us in our decision making is trustworthy. If the measurement error is unacceptable (i.e., very large), we will likely need to focus attention on improving the measurement process before proceeding on our project. In fact, Green Belts and Black Belts at many companies have found measurement processes that have so much error that their entire project was rescoped to “improve the measurement process.”
Measurement System Analysis
Measurement Systems Analysis is a structured test used to learn as much as possible about the measurement process in a short amount of time. Note that MSA is sometimes referred to as a “GR&R” (short for gage repeatability and reproducibility).
Purpose of MSA
The objective of an MSA is to learn as much as possible about the measurement process in a short amount of time. MSA uses an experimental and mathematical method to identify and quantify the causes of variation that affect a measuring system. Variation in measurements can be attribute to variation in the product, transaction, or service itself or to variation in the measurement system (measurement error).
It is crucial to do a Measurement System Analysis before moving on with data-driven decision making techniques such as Statistical Process Control, Correlation and Regression Analysis, and Design of Experiments.
Measurement System Study
A measurement system study must be well designed to obtain accurate information about the measurement process. Several key elements must be considered when designing a measurement system study:
People, SOPs, data-recording devices, etc., which represent the usual measurement process. You want to simulate the real-life conditions under which the measurements will be made.
• Parts (or items to be measured) should be randomly selected so they represent at least 80% of the total range of the process variation. Selecting an artificially tight range can make a measurement process appear worse than it really is. Likewise, selecting an artificially wide range can make a measurement process appear better than it really is. Techniques, such as descriptive sampling, can be used to generate representative samples, but are beyond the scope of this guide.
• Each part (or item) should be measured multiple times (at least twice), if possible, using the same procedures by each person or operator. Carefully define what you meanby “operator.” An “operator” may literally be a person—a technician who normally uses the measurement device to take the measurements. Or, we may use the term “operator” more generically to represent a gage or test fixture. Your definition of operator in an MSA study depends on the particular measurement system process you’re studying and what you want to learn.
• The parts, transactions or services should be measured as independently as possible to avoid any measurement bias. This is often accomplished with “blind marking”—avoiding visual markings that give clues to previous measurement determinations, measurements made by other operators, and so on. Also, you’ll want to randomize the parts, transactions, or services and the sequence of measurements during the study to prevent as much bias as possible.
• You want to ensure an adequate sample size for the study.
(insert image sample size rules of thumb)
MSA Examples
Attribute data when the data analyzed is pass/fail or binary (two outcomes)
When analyzing the data from an attribute-data MSA, four key measures, or indicators, are used to assess the measurement system. These indicators are like ratings, or grades, for the measurement process. They are: effectiveness, probability of false rejects, probability of false accepts, and bias.
When interpreting the results of an attribute-data MSA, what constitutes an “acceptable” measurement system depends on its application and the criticality of a mistake.
Variables-Data MSA-when the data analyzed is measured on a continuous scale
If possible, it is preferable to work with variables (as opposed to attribute) data. Examples of variables data include: lengths (measured in centimeters), weights (measured in kilograms), and pressures (measured in pounds per square inch). Variables data provides much more information about a process or product than simply meeting or not meeting a specification. Any measurement system involving variables data has three desired properties:
1. Accuracy: the ability to produce an average measured actual value that agrees with the true value or standard being used
2. Precision: the ability to repeatedly measure the same product or service and obtain the same results
3. Stability: the ability to repeatedly measure the same product or service over time and obtain the same average measured value
Which archer would you prefer on your team?
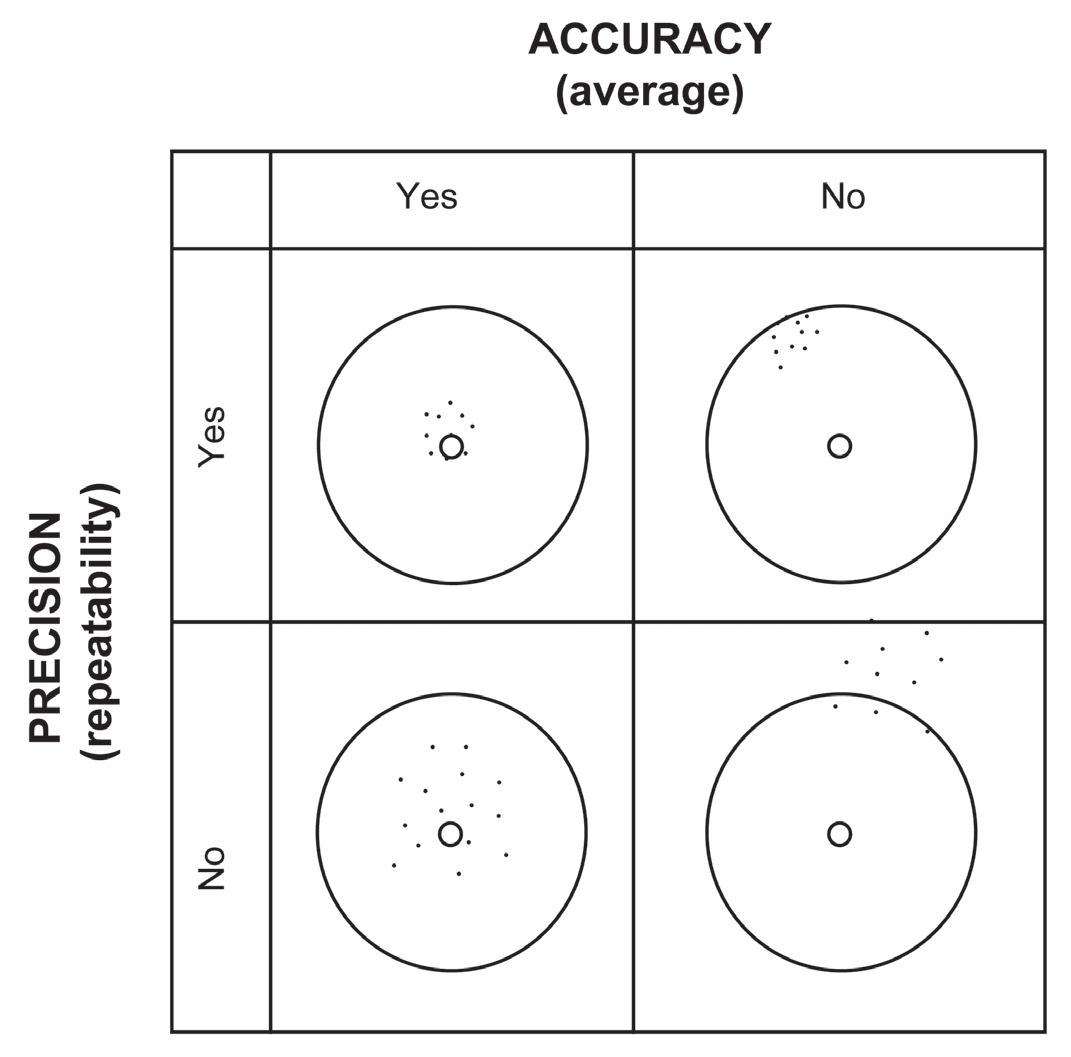
The one in the top left corner, of course, because that is the person who is both accurate and precise. We desire the same qualities in our measurement system.
SPCXL™ software training tutorials: https://airacad.com/our-insights/training-videos/spc-xl/

