For several years quality improvement has been a “hot topic” in many trade journals, professional societies, and inside numerous companies. In fact, the acronym “TQM,” which stands for Total Quality Management, has in many circles almost become a “rite of passage.” The TQM initiative started with electronic and automobile manufacturing in the late 70s and early 80s and has now spread to healthcare, banking, and other service-oriented companies. With all the excitement about TQM, millions of dollars have been spent on training and consulting. This huge expenditure has led some companies to loathe the use of the acronym TQM, because they have not realized the return on investment (ROI) that they originally expected. Obviously, the question of why the ROI has not been as expected is one many organizations are pondering.
The teaching of TQM philosophies and tools varies substantially and some approaches have better results than others. When results are less than satisfactory, the temptation is to blame the training or the whole total quality movement. Oftentimes, finding the root cause for poor results is not that simple.
This article will take an in-depth look at why some companies do not receive substantial ROI from their TQM efforts. The basic problems discussed relate to inadequate emphasis on waste reduction, poor management practices, and lack of proper metrics.
Consider some ugly facts from the 70s and 80s:
- In 1970, 17 firms produced televisions in the United States. Today there is only one. Most televisions sold today are made in Pacific Rim countries.
- Between 1970 and 1988, our share of the USA’s consumer electronics market fell from 100% to under 5%.
- Of the top ten banks in the world (ranked by assets), Japan has seven, France has two, and the United States has one. Fifteen years ago the United States dominated that list.
- The 1989 healthcare bill for the U.S. was over $600 billion, more than 11% of the gross national product. This sum is so large that if the American healthcare industry was declared a nation it would have the sixth largest gross national product of all the nations on earth.
One would think that companies aware of these facts would immediately be motivated to prevent similar things from happening to them. For certain, many consultants (internal and external) have sprouted up because of the unhealthiness of U.S. industry, yet not enough companies have changed for the better. For example, consider the results of a USA Today literature review over 1992.
Ugly facts from the 90s:
- Boeing Layoffs: Boeing says it expects to cut about 8,000 jobs this year, both through layoffs and attrition. (2/20/92)
- Leaner IBM: Thousands of employees must find a job elsewhere in the company or leave with severance pay. The notices are part of IBM’s announcement in December to cut up to 20,000 jobs worldwide this year… IBM had about 344,000 employees worldwide at the end of December after cutting more than 29,000 jobs last year. (4/13/92)
- Exxon Layoffs: Exxon USA will cut its white-collar workforce by at least 1,000, or 10% because of weak demand and low energy prices. (5/18/92)
- Northwest Cuts: Northwest Airlines has announced the elimination of nearly 900 jobs in recent weeks. (7/30/92)
- General Dynamics will lay off 5,800 workers by the end of 1994 at its Fort Worth division. It has cut 10,000 workers since 1990. (7/30/92)
- More Computer Jobs Cut: Hewlett-Packard says it will trim about 2,700 jobs …, Compaq said it will cut 1,000 workers … (10/9/92)
- Digital Equipment Corp. plans to trim its workforce by 25,000 the next few years to 88,000 worldwide. DEC, which cut 5,300 jobs last quarter, says it will cut more this quarter. (10/15/92)
- GM Buyouts? GM goal of cutting 54,000 hourly workers by 1995 … plans announced in December to close 21 plants and cut 74,000 jobs.
- Bank Failures: The Federal Deposit Insurance Corp. expects just over 100 banks to fail this year. About 85 banks have already failed this year. The FDIC expects 100 to 125 banks to fail next year. (10/19/92)
- United Technologies Cuts: Its Pratt & Whitney unit will lay off 7,500 workers by the middle of next year, 4,800 more layoffs at the jet-engine maker than previously announced. (10/19/92)
- Pay Freeze at RJR Unit: RJR Nabisco Holdings says it is freezing salaries at its food group for a year to keep costs down. One-fourth to one-third of the group’s 25,000 North American employees will be affected. (10/20/92)
- L.A. Times Cuts: Economic woes are forcing the Los Angeles Times to close its 14-year-old San Diego edition and cut jobs, offering voluntary severance to 5,200 of its 7,500 full-time workers, hoping to cut 500 jobs. (11/9/92)
- Kodak Layoffs: Eastman Kodak plans to lay off up to 3,000 workers the next six months. . . More than 8,000 workers left Kodak the past 18 months after the company offered a lucrative early retirement plan. (1/8/93)
This list does not include all of the companies that experienced problems in 1992 nor does it contain numerous additional headlines from 1993 through today. With evidence like this it is difficult to deny that a major problem exists. USA Today, August 31, 1993, contains an article, “Bargain prices have a cost: Job cuts.” This article by Gary Strauss indicates that “pressure to keep prices low, maintain market share and boost corporate earnings has long forced layoffs in hard pressed industries, such as automobiles and computers.” The article goes on to state that IBM will cut 100,000 employees by 1995, and that other companies, such as Proctor and Gamble, AT&T, Merck, Johnson & Johnson, and Sprint, are also announcing layoffs.
Why are so many companies struggling?
Although many articles and books have been written about this problem, the diagram shown in Figure 1 penetrates the heart of the issue. Consider Figure 1.a where the price of any product or service is driven by profits and total cost to produce. In Figure 1.b, the total cost to produce can be broken into two categories: (1) the cost associated with doing only the right things right the first time (theoretical cost), and (2) the waste or non-value added cost (referred to as the Cost of Poor Quality or COPQ). According to quality gurus such as Deming, Juran, etc., the percentage of COPQ in most companies is 20-40%. Now consider Figure 1.c where global competition, customer-driven fixed cost, or budget cuts have mandated a lower and more competitive price. The company represented by Figure 1.d has responded to the newly lowered price by laying off approximately 1/3 of its work force and/or selling off non-profitable assets, but it has done very little to cut the COPQ.
Unfortunately, this response is typical of many U.S. managed companies who seem to be more concerned about short-term profitability than they are about long-term stability. The company that will survive global competition in the 1990s and on into the twenty-first century is depicted in Figure 1.e. It has attacked and cut its COPQ significantly. The key to competitiveness and survival is tied to reducing the 20-40% waste. This Cost of Poor Quality is due to high cycle times, long development times, high defect rates (or low yields), poor productivity, excessive inventories, training without ROI, lack of customer focus, and many other non-value added activities. Lowering COPQ is a difficult strategy in the short term, but it is the only way to long-term profitability, competitiveness, and the ability to weather hard times.
FIGURE 1
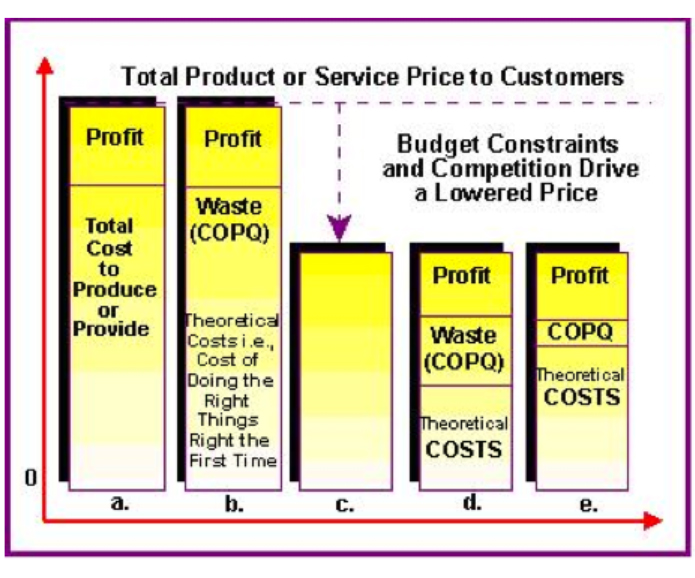
Which strategy is your company pursuing? If your company is not depicted in Figure 1.e, what are your plans to lower COPQ before or faster than your competition does? From our observations, most companies do not have the slightest clue as to what their COPQ is. Maybe it is because they don’t have the time or the proper accounting methods to investigate or estimate their waste. Perhaps they don’t care to know for fear of having to face the music. The simple fact is this: “If your TQM effort does not include a plan for measuring ROI, don’t expect to get it.”
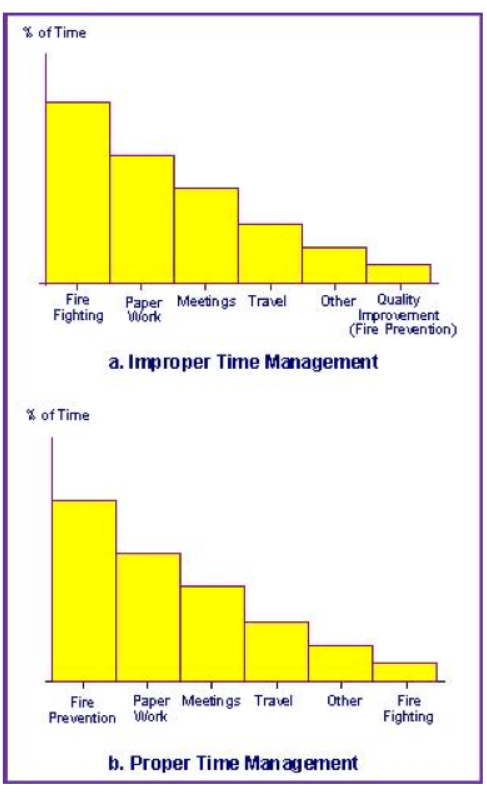
Another reason for not receiving ROI is a claim by people in industry that they do not have enough time. An informal survey from several companies revealed that an approximate Pareto diagram for time spent appears as shown in Figure 2.a. It will be hard to receive ROI regardless of how much training (good or bad) we give scientists, engineers, technicians, and operators, if they don’t have time to implement what they have learned. This is a management problem! First, a manager must learn where his/her people are spending their time, and then develop a way to increase the amount of time spent on fire prevention (quality improvement) and decrease the amount of time spent on fire fighting (waste management). Any successful fire department knows that the ROI from a strong fire prevention program far exceeds that from more expensive fire-fighting equipment. Thus, it does not make sense to initiate a TQM effort if time will not be allocated to achieving ROI. See Figure 2.b for a more proper time management scenario.
FIGURE 2
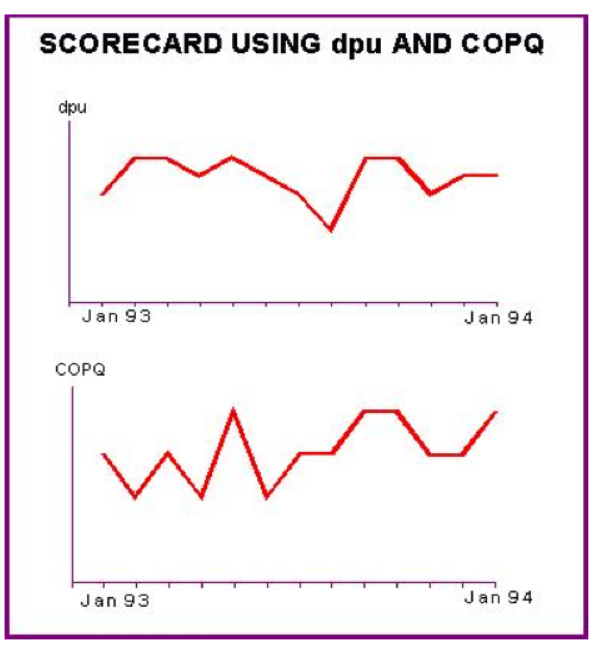
A third aspect of the ROI problem is the fact that everyone seems to be talking quality improvement, but no one is keeping score. Many corporate vice presidents claim that their scientists, engineers, technicians, and operators have been trained but they are not getting the needed support from middle management. Common sense would indicate that they are not keeping score or, at the very least, not keeping the right score on middle management. For example, if middle managers are responsible for processes which have computable measures of quality, such as defects per unit (dpu), Cpk, cycle time, or COPQ, they should be plotting these measures over time. If a plot of dpu or COPQ appears as shown in Figure 3, it will be difficult convincing anyone that the process demonstrates quality improvement. The scorecard simply does not show it. Unfortunately, most vice presidents are not keeping score on their managers, and managers are not keeping score (or the right score) on scientists, engineers, technicians, operators, etc. In many cases, those who are keeping a scorecard are measuring the time to put out fires instead of tracking the number of fires, discovering the root causes of these fires, and removing them. In fact, many companies reward successful fire fighters but neglect to reward successful fire preventers.
FIGURE 3
Motorola University has propagated the following thought: “If what we know about our processes cannot be expressed in numbers, we don’t know much about them. If we don’t know much about them, we can’t control them. If we can’t control them, we can’t compete.”
This quote can be complemented by what Vince Lombardi once said: “If we’re not keeping score, we’re only practicing.”
It is obvious that U.S. companies are doing more than their share of practicing. If we are going to win (and we must in order to stay in business) then we must keep score on the right things related to quality and not just products shipped. It is unbelievable how many bonus programs are still connected to products shipped or services rendered instead of waste removal, fire prevention, and quality improvement.
If you have been implementing TQM and paying a lot for training, are you getting ROI? If not, have you looked for the root cause? It may be that you are losing the game, and worse yet, you don’t know it. Our suggestion is to subject the entire organization to an intense “physical examination”. In other words, determine the health of your organization. You might start with a list of questions managers need to answer, similar to those in Table 1, and follow that up with a series of questions managers need to ask, with the expectation that team members and practitioners can get the answers. See Table 2. The ability or inability to answer the questions in Tables 1 and 2 will highlight your weaknesses and provide direction for future efforts. Table 3 provides some barriers to being able to answer those questions. These barriers must be removed!
QUALITY IMPROVEMENT ORIENTED QUESTIONS MANAGERS NEED TO ANSWER!
- What is your product or service and who are your customers?
- What perception do your customers have of your product or service? How do you know?
- Do you believe quality issues are important to your company? Why? Which ones?
- What is the company’s current share of the total market? Can quality improvement efforts assist you in increasing the market share and/or increasing profits? How?
- Are you actively pursuing quality improvement in your areas of responsibility? How?
- How many hours (days) per week (month) do you currently have scheduled (on your calendar) that are devoted strictly to quality issues?
- How often per week (month) do you solicit feedback from the people you manage? What kind of feedback do you solicit? What do you do with the feedback?
- What are the right quality-oriented questions managers need to ask their people? What methods or tools can be used to answer them?
- Are your people trained to successfully use the best quality improvement tools?
- What is your Return On Investment (ROI) from the training?
- Do you have a standard procedure for documenting quality improvement efforts? What is it?
- What barriers do your people face when trying to do quality improvement? What are you doing to remove these barriers?
- What metrics are you evaluated on that relate to quality issues? Are you held accountable for these metrics? What are the specific improvement goals for these metrics?
- How much waste does your company have? That is, what (in dollars) is the company’s Cost Of Poor Quality (COPQ)? How much of the total waste is your area responsible for?
- One year from now what evidence will you have to show that you made a difference?
QUALITY IMPROVEMENT ORIENTED QUESTIONS MANAGERS NEED TO ASK THEIR PEOPLE!
- What processes (activities) are you responsible for? Who is the owner of these processes? Who are the team members? How well does the team work together?
- Which processes have the highest priority for improvement? How did you come to this conclusion? Where is the data that led to this conclusion? For those processes to be improved,
- How is the process performed?
- What are your process performance measures? Why? How accurate and precise is your measurement system?
- What are the customer driven specifications for all of your performance measures? How good or bad is the current performance? Show me the data. What are the improvement goals for the process?
- What are all the sources of variability in the process? Show me what they are.
- Which sources of variability do you control? How do you control them and what is your method of documentation?
- Are any of the sources of variability supplier-dependent? If so, what are they, who is the supplier, and what are we doing about it?
- What are the key variables that affect the average and variation of the measures of performance? How do you know this? Show me the data.
- What are the relationships between the measures of performance and the key variables? Do any key variables interact? How do you know for sure? Show me the data.
- What setting for the key variables will optimize the measures of performance? How do you know this? Show me the data.
- For the optimal settings of the key variables, what kind of variability exists in the performance measures? How do you know? Show me the data.
- How much improvement has the process shown in the past 6 months? How do you know this? Show me the data.
- How much time and/or money have your efforts saved or generated for the company? How did you document all of your efforts? Show me the data.
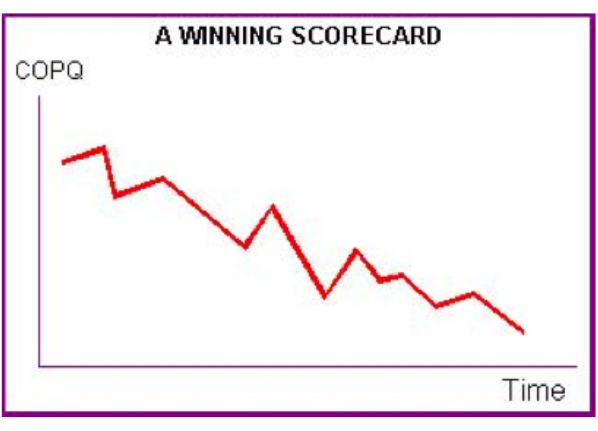
Using metrics like COPQ will further motivate management to focus on the problems requiring attention. Then, management should decide on what scorecards are important for each process and each level of employee. Next, managers who understand the role of all the applicable quality improvement tools needed to answer questions in Table 2 should select the proper training for their people and support the applications of the training tools. Score keeping is mandatory to prevent the daily routine from becoming nothing more than mere practice. Keeping score cannot be construed as collecting evidence to fire someone; rather, it must be used to tell us how the process is doing (i.e., whether we are winning or losing). In addition, management must ensure that scorecards are implemented in a way that motivates people to ethically play to win rather than motivating them to falsify data to avoid looking bad. Figure 4 depicts a winning scorecard.
FIGURE 4
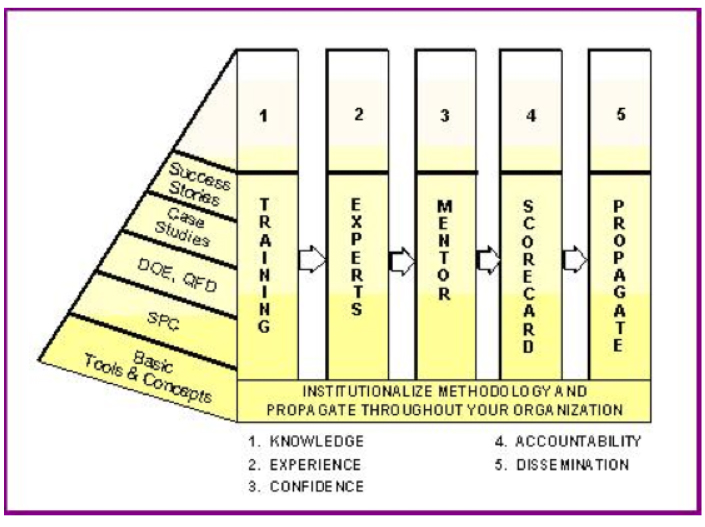
It shouldn’t be a news flash that “TQM without commitment to improve, a scorecard, and accountability will produce little to nothing in ROI.” Figure 5 depicts a strategic plan for training, implementation, accountability and dissemination. The bottom line is very simple: if your company is committed (at all levels) to keeping the right score and playing to win, people will demand the right training at the right time, managers will support the training, and ROI will follow.
FIGURE 5
BARRIERS TO CONTINUOUS IMPROVEMENT (Based on Class Surveys)
| MANAGEMENT | TIME | COMMUNICATIONS |
|---|---|---|
| Lack of leadership | Too busy firefighting | Poor documentation |
| Few role models | People are weary from long hours | Culture not right for sharing knowledge |
| Unclear direction | Improper time management | Poor knowledge of customer needs |
| Misperception of PF/CE/CNX/SOP/ SPC/DOE |
Duplicated effort | Don’t let suppliers know how to help us |
| Not willing to increase emphasis on gaining complete knowledge in R&D and design | Too many arguments without facts and data | Inability to properly present something |
| Not willing or knowledgeable to ask the right questions (see Table 2) | Perception that proper tools (PF/ CE/CNX/ SOP/SPC/DOE) take too much time |
Communicate to managers with emotion instead of facts, data and dollars |
| Does not encourage enough time to plan | Too many unproductive meetings | Conflicting messages |
| Too many layers | Timeline pressure | Information Politics |
| Wants immediate results versus substantial growth in knowledge through use of scientific method | Too busy reorganizing | Tools for properly communicating process information not known or used |
| Don’t track the right metrics | ||
| Ignorant of the new tools for success | ||
| Not focused on knowledge gained per resource per unit time | ||
| Continued emphasis on old ways of doing business | ||
| Reluctant to support new methods | ||
| Inadequate emphasis on waste (COPQ) identification and reduction |
| TRAINING | RESOURCES | REWARD SYSTEM | ATTITUDE AND MOTIVATION |
|---|---|---|---|
| Not enough people properly trained |
Limited resources | Promotes firefighting | Laziness |
| Inability to think and use common sense |
R&D and Design don’t scale up |
Supports traditional power centers |
Don’t perceive problems as threatening |
| Some people need a refresher course |
Insufficient manpower | People not held accountable |
Rush to get results without planning |
| Management last to be trained versus first |
Insufficient internal experts to assist others |
People (groups) compete against each other versus helping |
Easier to blame others than to take responsibility |
| Need more motivation in training of basic tools |
Inadequate or inappropriate use of outside consultants |
Perception that powerful tools will uncover previously missed knowledge |
Critical and/or negative attitudes |
| Need for a mentor program |
Improper allocation of resources |
No consequences for not implementing continuous improvement |
Resistance to change |
| Need for follow-up assistance |
Professional firefighters feel threatened |
||
| Lack of funding | New concepts take time | ||
| Not enough emphasis on COPQ, how to identify it and reduce it |
Fear of failure using new methods |
||
| Suppliers need to be trained |
Fear of downsizing | ||
| Unqualified trainers | Unwilling to share what you know with others |
||
| Training is not JIT | Lack the “will to win” | ||
| Not enough emphasis on ROI |
For more information about TQM, SCORECARDS, and ANSWERS TO THE QUESTIONS ON TABLES 1 and 2 check the book Knowledge Based Management


